Brezplačna dostava za naročila nad 69.99 € na paketomatih Pošte Slovenije.
Postanite del skupnosti ljubiteljev knjig z vsega sveta in uživajte v številnih ugodnostih.
Ustvarite brezplačen račun
Brezplačna dostava Zásilkovna nad 69.99 €
Zbirna točka GLS 4.49 €
Zbirna točka DPD 2.99 €
Kurirska služba GLS 5.49 €
Kurir DPD 3.49 €
Kurirska služba 3.49 €
Zbirno mesto 3.49 €
Zbirno mesto 3.49 €
Dostava preko Pošte Slovenije 3.49 €
 Kontakt
 Kako nakupovati
Pomoč
Dostava
Zbirna točka GLS 4.49 €
Zbirna točka DPD 2.99 €
Kurirska služba GLS 5.49 €
Kurir DPD 3.49 €
Kurirska služba 3.49 €
Zbirno mesto 3.49 €
Zbirno mesto 3.49 €
Dostava preko Pošte Slovenije 3.49 €
Brezplačna dostava Zásilkovna nad 69.99 €
Svetovalec pri nakupu
Moj račun
▸
Prazna :-(
0
Brezplačna dostava za naročila nad 69.99 € na paketomatih Pošte Slovenije.
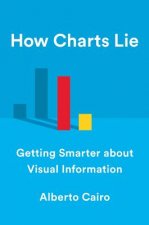
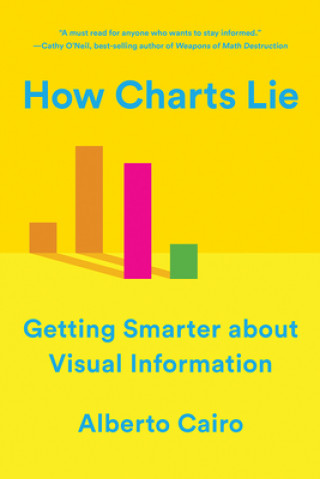
How Charts Lie
Jezik
 Angleščina
Angleščina
Knjiga
Mehka
Today, public conversations are increasingly driven by numbers. While charts, infographics, and diag...
Celoten opis
Koda Libristo: 25585265
?
 31 b
31 b
31 b
12.94
€
Na zalogi pri dobavitelju
Odposlali bomo v 6-10 dneh
30 dni za vračilo blaga
Drugi so kupili tudi


 /
/
 Trda
Trda
 25.08
€
25.08
€


Today, public conversations are increasingly driven by numbers. While charts, infographics, and diagrams can make us smarter, they can also deceive - intentionally or unintentionally. To be informed citizens, we must all be able to decode and use the visual information that politicians, journalists, and even our employers present us with each day. Demystifying an essential new literacy for our data-driven world, How Charts Lie examines contemporary examples ranging from election result infographics to global GDP maps and box office record charts, as well as an updated afterword on the graphics of the COVID-19 pandemic.
Igralka
&
Poliglotka
EWA KASP
za
Predvajaj video


Libristo ima največjo izbiro tujejezične literature. Zato svoje knjige kupujem tukaj.
O knjigi
Polni naslov
How Charts Lie
Avtor
CAIRO ALBERTO
Jezik
Angleščina
Angleščina
Vezava
Knjiga - Mehka
Datum izida
2020
Število strani
256
EAN
9780393358421
ISBN
0393358429
Koda Libristo
25585265
Založba
WW Norton & Co
Teža
296
Mere
208 x 139 x 21